Engineering Thermodynamics: Unit IV: Properties of Pure Substances
T-S Diagram (for water)
Thermodynamics
T-s is the plot of the saturation temperature of water and steam corresponding to the various absolute pressures against the entropies at those saturation temperatures.
T- s DIAGRAM (FOR WATER) T-s is the plot of the saturation temperature of water and steam corresponding to the various absolute pressures against the entropies at those saturation temperatures. It is shown in Figure 4.6. It is helpful to solve the numerical problems on steam as it considerably reduces time and labour in making calculations. In T-s diagram (for water), in the region left side of the water line, the water exists as liquid. In the right side of the dry steam line, the water exists as a superheated steam. In between water and dry steam lines, the water exists as wet steam. Therefore, the dryness fraction lines (constant quality lines) are represented in these regions as shown in Figure 4.6. The value of various quantities can directly be read form the diagram. The water line and steam line are converging with increase in temperature. At a particular point, the water is directly converted into dry steam without forming the wet steam. This point is called critical point. An isothermal process is represented by a horizontal line and a reversible adiabatic or isentropic process is represented by a vertical line. In the diagram, constant volume lines are plotted in the wet region and constant pressure lines are plotted in the superheated region.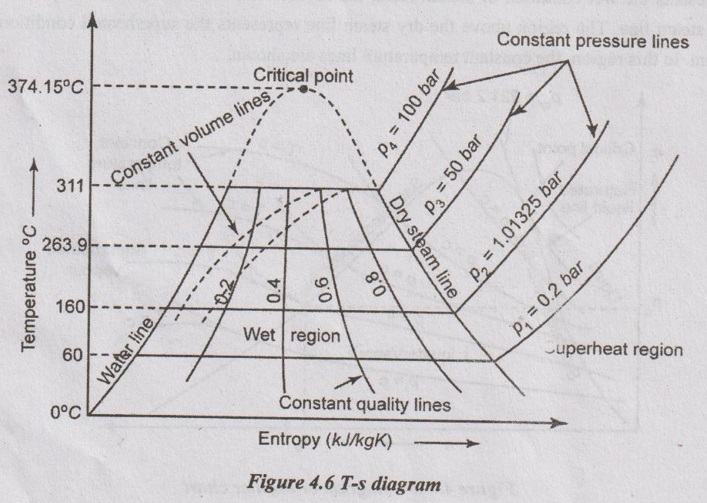
Engineering Thermodynamics: Unit IV: Properties of Pure Substances : Tag: : Thermodynamics - T-S Diagram (for water)
Related Topics
Related Subjects
Engineering Thermodynamics
ME3391 3rd semester Mechanical Dept | 2021 Regulation | 3rd Semester Mechanical Dept 2021 Regulation