Engineering Thermodynamics: Unit IV: Properties of Pure Substances
P-V Diagram of Pure Substances
Thermodynamics
p-v diagram is the plot between specific volume and pressure.
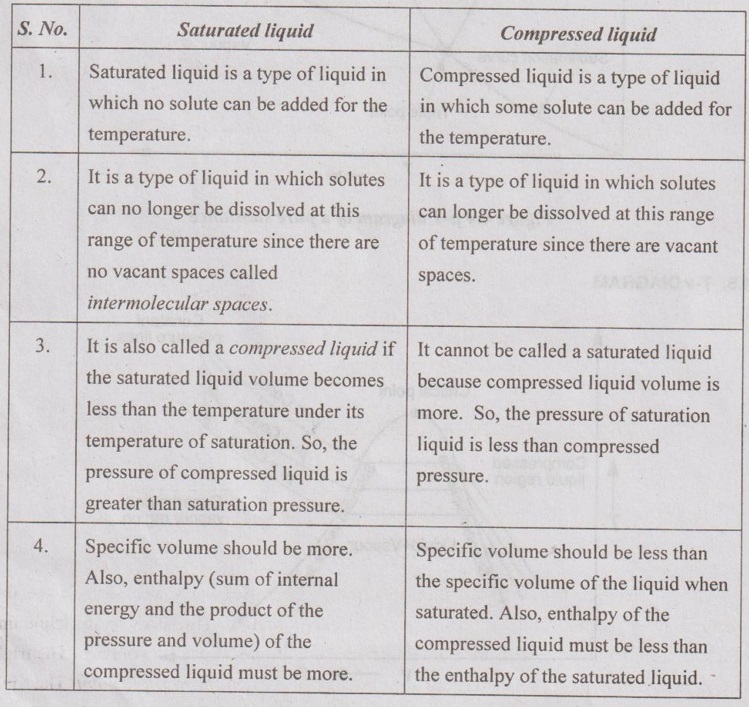
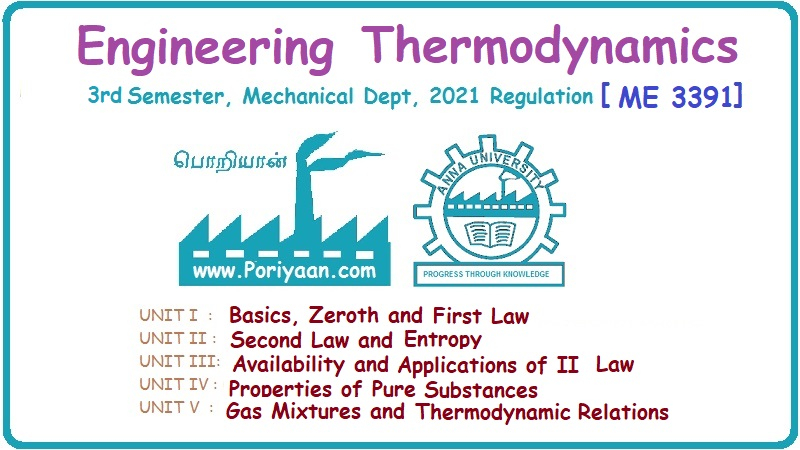
p-V DIAGRAM p-v diagram is the plot between specific volume and pressure. Specific volume is taken along X-axis and pressure is taken along Y-axis. The state changes of a pure substance when it is slowly heated at various constant pressures as shown in Figure 4.2. Most of the substances contract during a solidification or freezing process. Some substances such as water expand as they freeze. p-v diagram for both type of substances are given in Figure 4.2 and Figure 4.3. These two figures differ only in the solid-liquid saturation region. In both p-v diagrams, the region left side of the saturated liquid line, the substance exists as liquid. In the right of the saturated vapour line, the substance exists as a superheated vapour. In between liquid and saturated vapour line, the substance exists as a liquid-vapour mixture. The region left side of the saturated solid line is solid region. Between two saturated liquid lines, there is a compressed liquid region. On p-v diagram triple-phase states, it forms a line called triple line. This is the line where all three phases, solid, liquid and gas exist in equilibrium. The states on the triple line of a substance have same pressure and temperature but different specific volumes. The triple line appears as a point on a p-T diagram and therefore, it is often called triple point. The triple point temperature and pressure of water are 273.16 K and 0.6113 kPa respectively. All three phases of water will exist in equilibrium only if the values of temperature and pressure are same as mentioned earlier. No substance can exist in the liquid phase at pressure below the triple-point pressure. Below the triple-point pressure, the substance from solid state is directly converted into vapour without forming liquid. This process is called sublimation. The saturated liquid line and saturated vapour line are converging with increase in pressure as shown in Figure 4.2 and Figure 4.3. At a particular point, the liquid is directly converted into vapour without forming the liquid-vapour mixture. This point is called critical point. The critical pressure, temperature and volume of water are 221.2 bar, 374.15°C and 0.00317 m3/kg respectively. Difference between saturated liquid and compressed liquid: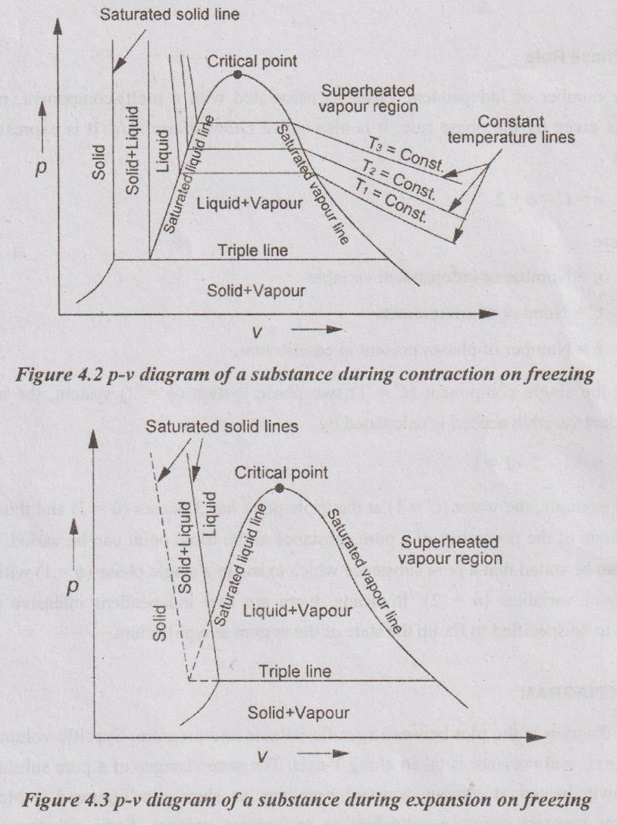
Engineering Thermodynamics: Unit IV: Properties of Pure Substances : Tag: : Thermodynamics - P-V Diagram of Pure Substances
Related Topics
Related Subjects
Engineering Thermodynamics
ME3391 3rd semester Mechanical Dept | 2021 Regulation | 3rd Semester Mechanical Dept 2021 Regulation