Engineering Thermodynamics: Unit I: Basics, Zeroth and First Law
P-V Diagram
Compression Process | Thermodynamics
A pressure-volume diagram (or p-V diagram or pV diagram) is used to describe corresponding changes in volume and pressure in a system.
p-V DIAGRAM A pressure-volume diagram (or p-V diagram or pV diagram) is used to describe corresponding changes in volume and pressure in a system. Consider a gas sealed in a container with a tightly fitting yet movable piston as shown in Figure 1.27. The work can be done on the gas by pressing the piston from point 1 to 2. When the gas is subjected to these thermodynamics processes, the pressure and volume of the gas can change. A convenient way to visualize these changes in the pressure and volume is by using a pV diagram. Each point on a pV diagram corresponds to a different state of the gas. The pressure is given on the vertical axis and the volume is given on the horizontal axis. The work done during a thermodynamic process is equal to the area under the curve. The reason why work is equal to the area under the curve is that, W = FΔx = (pA)Δx = p(AΔx) = pΔV Since pΔV is the work which is equal to the area under the curve 1-2. If the path on a pV diagram is directed to the left (as in the Figure 1.27), the volume is decreasing, and work is being done on the system. Therefore, W is negative work. If the path on a pV diagram is directed to the right, the volume is increasing, and work is being done by the system. So, W is positive work.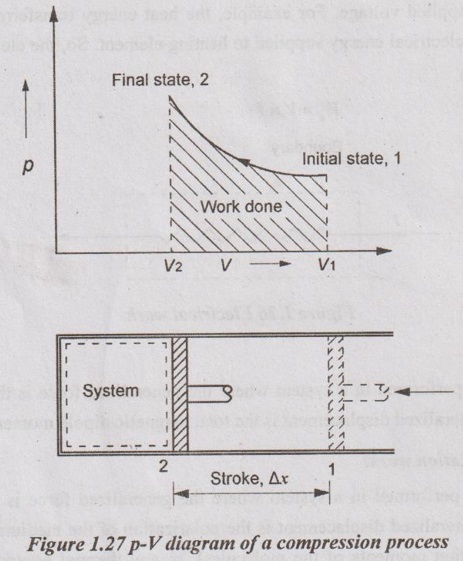
Engineering Thermodynamics: Unit I: Basics, Zeroth and First Law : Tag: : Compression Process | Thermodynamics - P-V Diagram
Related Topics
Related Subjects

Engineering Thermodynamics
ME3391 3rd semester Mechanical Dept | 2021 Regulation | 3rd Semester Mechanical Dept 2021 Regulation