Engineering Thermodynamics: Unit IV: Properties of Pure Substances
P-T Diagram, T-V Diagram of Pure Substances
Thermodynamics
The state changes of a pure substance when it is slowly heated at different constant pressures plotted on p-T coordinate as shown in Figure 4.4.
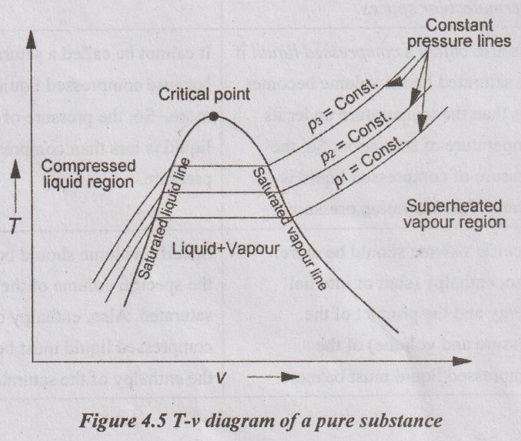
p-T DIAGRAM The state changes of a pure substance when it is slowly heated at different constant pressures plotted on p-T coordinate as shown in Figure 4.4. T-v DIAGRAM The general shape of T-v diagram of a pure substance is similar to p-v diagram but p = constant lines on this diagram have an upward trend as shown in Figure 4.5. In T-v diagram, the substance which lies in the region left side of the saturated liquid line is for compressed liquid. In the right side of the saturated vapour line, the substance exists as a superheated vapour. In between liquid line and saturated vapour line, the substance exists as a liquid-vapour mixture. The saturated liquid line and saturated vapour line are converging with increase in pressure as shown in Figure 4.5. At a particular point, the liquid is directly converted into vapour without forming the liquid-vapour mixture. This point is called critical point. Above the critical point, there is no line that separates the compressed liquid region and superheated vapour region.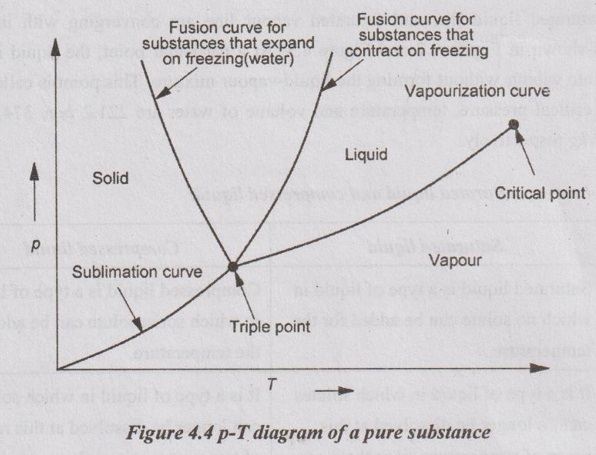
Engineering Thermodynamics: Unit IV: Properties of Pure Substances : Tag: : Thermodynamics - P-T Diagram, T-V Diagram of Pure Substances
Related Topics
Related Subjects
Engineering Thermodynamics
ME3391 3rd semester Mechanical Dept | 2021 Regulation | 3rd Semester Mechanical Dept 2021 Regulation