Engineering Thermodynamics: Unit IV: Properties of Pure Substances
h-s Diagram or mollier chart
Pure Substances | Thermodynamics
It is also called Mollier chart. In h-s diagram, the vertical ordinate represents the enthalpy while the base represents the entropy as shown in Figure 4.7.
h-s DIAGRAM OR MOLLIER CHART It is also called Mollier chart. In h-s diagram, the vertical ordinate represents the enthalpy while the base represents the entropy as shown in Figure 4.7. In h-s diagram, the dry steam line divides this chart into two regions. The region which is below the dry steam line represents the wet condition of steam. Here, the dryness fraction lines are shown parallel to dry steam line. The region above the dry steam line represents the superheated condition of steam. In this region, the constant temperature lines are shown. At the same time, the lines at constant pressure are straight in the wet steam region but it is curved in the superheated region. An adiabatic process is represented by a vertical line on h-s diagram. Throttling process in which enthalpy remains constant is represented by a horizontal line. With the help of this diagram, the heat drop during the adiabatic expansion can be directly read. Constant volume process, constant pressure process and constant temperature process can be represented on the lines already plotted.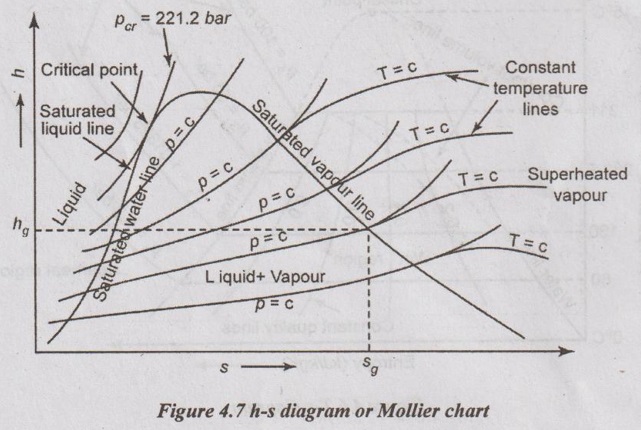
Engineering Thermodynamics: Unit IV: Properties of Pure Substances : Tag: : Pure Substances | Thermodynamics - h-s Diagram or mollier chart
Related Topics
Related Subjects
Engineering Thermodynamics
ME3391 3rd semester Mechanical Dept | 2021 Regulation | 3rd Semester Mechanical Dept 2021 Regulation