Engineering Thermodynamics: Unit V: Gas Mixtures and Thermodynamic Relations
Generalised Compressibility Chart
Advantages | Thermodynamics
The following observations can be made from the generalized compressibility chart.
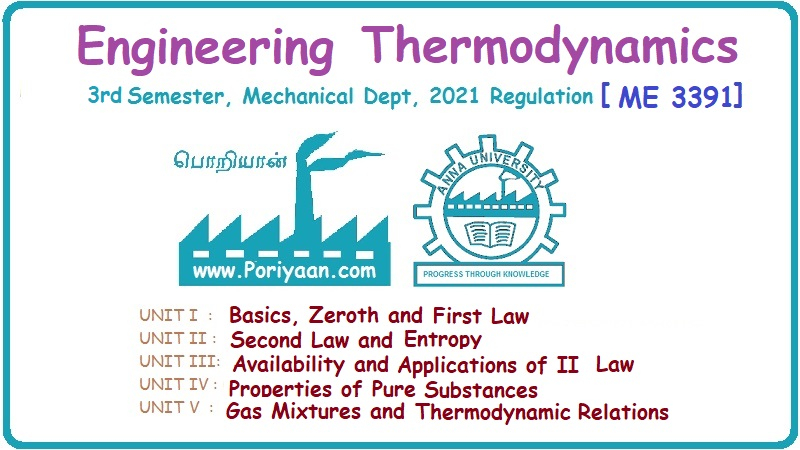
GENERALISED COMPRESSIBILITY CHART The general compressibility chart is plotted between compressibility factor (Z) and reduced pressured (pr) for various values of reduced temperature (Tr). In this chart, reduced pressure (Pr) is plotted on x-axis and Z is plotted on the y-axis. It is constructed by plotting the known data of one or more gases and it can be used for any gas as shown in Figure 5.4. Figure 5.4 (a) is the low-pressure chart, for reduced pressures between 0 and 1 and Figure 5.4 (b) is the chart for reduced pressures between 0 and 7 as it is seen on the x-axis. Simplified version of this chart is shown in Figure 5.5. The solid curves on this diagram are the family of curves for constant reduced temperature. These curves generally run from the upper left-hand corner downwards and towards the right-hand edge of the diagram. The solid curves represent constant Tr by reading the labels on the curves for Tr = 1.0 and Tr = 5.0. The dashed line curves on this diagram are the family of curves for constant ideal reduced molar volume. It can be seen from Figure 5.5 that the value of Z tends to unity for all temperatures as pressure approach zero and Z also approaches unity for all pressure at very high temperature. The following observations can be made from the generalized compressibility chart. 1. For different gases, the behaviour changes on the basis of thermal properties such as reduced pressure and reduced temperature. 2. At very low pressures (pr << 1), the gases behave as an ideal gas. 3. At high temperatures (Tr > 2), ideal-gas behaviour is assumed with good accuracy of pressures. 4. The deviation of a gas from ideal-gas behaviour is the greater in the vicinity of critical point. (a) It is the compressibility factor Z can be directly read from the chart for different values of reduced pressures which are useful in solving a wide variety of gas-law problems. (b) The reduced properties in the chart indicate the status of the substance from critical point. This chart can be used for constant property processes such as constant temperature processes following a Tr, line, constant pressure processes following a vertical Pr line, and constant specific volume processes following a vr line.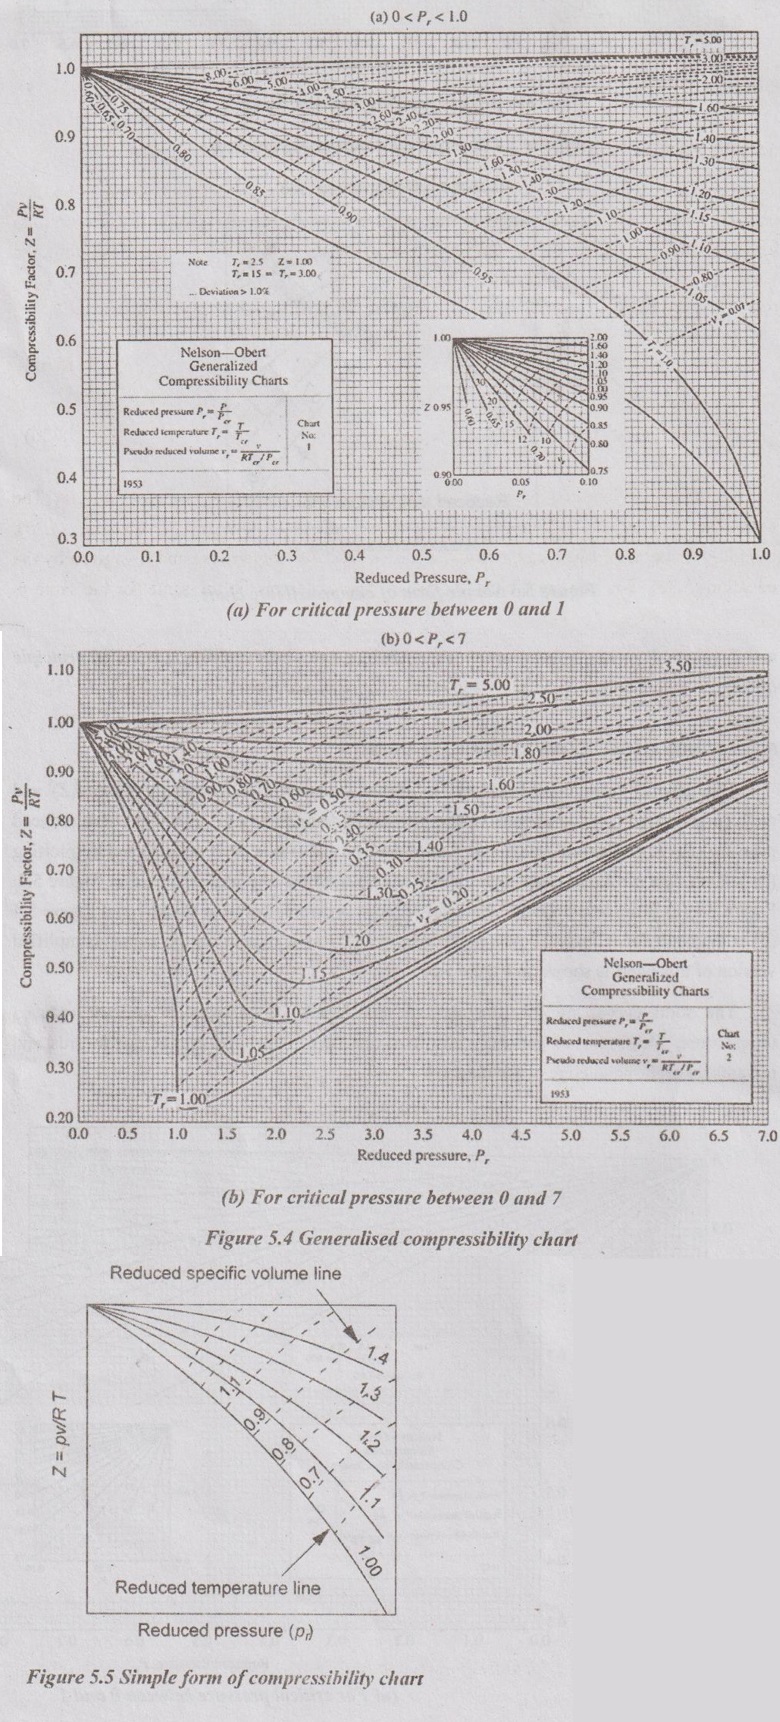
1. Advantages of Generalized Compressibility Chart
Engineering Thermodynamics: Unit V: Gas Mixtures and Thermodynamic Relations : Tag: : Advantages | Thermodynamics - Generalised Compressibility Chart
Related Topics
Related Subjects
Engineering Thermodynamics
ME3391 3rd semester Mechanical Dept | 2021 Regulation | 3rd Semester Mechanical Dept 2021 Regulation