Manufacturing Processes: Unit IV: Sheet Metal Processes
Formability test methods
Sheet Metal Processes
Simple uniaxial tensile test is not much useful for the formability of sheet metals.
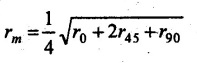
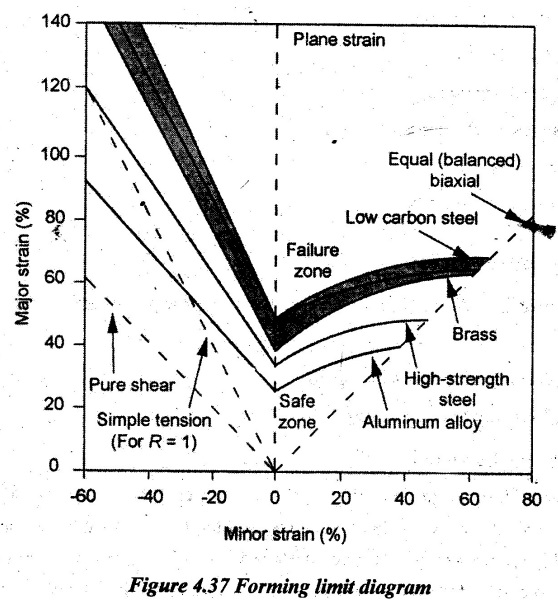
FORMABILITY TEST METHODS Simple uniaxial tensile test is not much useful for the formability of sheet metals. It is due to the biaxial or triaxial nature of stresses acting on the sheet metal during forming operations. Therefore, specific formability tests have been developed for sheet metals. 1. Formability test for bulk deformation 2. Formability test for elastic-plastic deformation 3. Simulative test for forming operation and Bulk deformation refers to the deformation of sheet metal due to both elastic and plastic deformation. Sometimes, the elastic deformation may be ignored because the ratio of elastic deformation to plastic deformation is always less than 0.2. This ratio is valid only for forging, extrusion and rolling process. This test includes the following parameters. 1. Stress-strain characteristics under actual working conditions 2. Process-economic analysis 3. Full scale experiments. To predict the forming behaviour of sheet metal, the following three tests are carried out: 1. Test methods based on tensile test 2. Simulative drawing tests and 3. Full scale forming tests. 1. Test methods based on tensile test: General metal forming operations based on tensile load are stretching and drawing. Tensile test is separately carried out for stretching and drawing operations. (i) Tensile test for stretch forming operations: Fracture of sheet metal is predicated by local thinning. At the same time, failure is avoided. The important property of work-hardening is predicted in terms of stress-strain. f = Aɛn where f = stress ε = Strain A and n are constants. For higher value of n, the strain distribution will be more uniform and there is a possibility to obtain deep pressing. If the friction between blank and tool is being high, the critical zone will be restricted. Generally n varies from 0.22 to 0.24. (ii) Tensile test for drawing operations: In this test, the sheet metal is deformed on the lower punch by thinning under bi-axial stresses. Then, the average value of sheet metal radius is determined by orienting the axis of the metal flow at 0° at 45° and 90°. Mean value of radius, Higher value of rm indicates good drawability which varies from 1.0 to 1.7. 2. Simulative tests: This test is conducted in various cup forming operations such as 1. Erichsen test 2. Olsen test 3. Swift test 4. Fukui test. In Erichsen and Olsen tests, the sheet is stretched over a hemispherical tool to form a dome cup shape. The height of the dome is considered as index of drawability. (i) Erichsen test: First, the standard specimen of 90 mm wide is rigidly clamped against a die having 27 mm diameter opening. A spherical punch of 20 mm diameter is moved against the sheet metal. The movement of the punch is continued until the fracture starts. At fracture, the bulge forms. The depth of bulge gives Erichsen number. This value is too small in assessing the drawability. This test is mainly carried out in assessing the stretchability of sheet metal. (ii) Olsen test: This test slightly differs from Erichsen test. The size of the standard specimen and rest are taken same as mentioned in Erichsen test. But the die opening size of 50 mm diameter is used. Here, the specimen is lightly clamped. The bulge and fracture are formed due to stretching only when the punch presses the sheet metal. This test is also carried out for assessing the stretchability. (iii) Swift test: Swift test involves pure drawing. In this test, flat bottomed cups of uniform diameter are formed from a series of metallic sheet blanks. But, these metallic blanks are of different diameters. This process is continued until the fracture occurs in all cups. Now, the blank size is found in all cups. In cup drawing process, a formability parameter known as limiting draw ratio is very useful. The limiting draw ratio is given by Limiting draw ratio, LDR = Blank diameter / Punchdiameter This test is carried out for assessing the drawability. The main disadvantage of this test is edge wrinkling due to lightly clamped blanks. (iv) Fukui test: In this test, the sheet is both drawn and stretched over a cup of conical shape. So, the stretchability and drawability can be assessed. Here, both the die and punch are in the form of conical shape. The fixed diameter blank is drawn between die and punch. The holding pressure on blank is gradually increased until the edge wrinkling is completely eliminated. Then, the cup depth is measured at maximum load which is referred as formability index. This index is used to assess both drawability and stretchability. 3. Full scale forming test: In this test, the Forming Limit Diagram (FLD) is obtained to describe the different strain conditions and their combinations with load to failure of sheet metal. Usually, the strain distribution is assessed from the surface. 3. Forming Limit Diagram (FLD) Forming limit diagram (FLD) is a very effective way of optimizing the sheet metal forming. A grid of circles is etched on the surface of a sheet metal. Then, the sheet metal is subjected to deformation. Usually, the sheet is deformed by stretching it over a dome shaped die. Strips of different width can be taken for the test in order to induce uniaxial or biaxial stress state. The circles deform into elliptic shapes. The strain along two principal directions could be expressed as the percentage change in length of the major and minor axes. The strain as measured near necks or fracture is the strains for failure. Actual strain on the sheet metal is determined by ε = (l - d)/d where l - Length of major or minor axes d = Corresponding concentric circle diameter Maximum surface strain, ε1 = Length of major axis Minimum surface strain, ε2 = Length of minor axis. The graph is then plotted between major and minor surface strains. This plot is called Keeler-Goodwin forming limit diagram. A typical forming limit diagram for various sheet metals is shown in Figure 4.37. The boundaries between safe and failed regions are represented in the forming limit diagram. Combination of various strains represented above the limiting curves in the diagram represents failure while those below the curves represent safe deformations. Higher is the position of the curve, greater will be the formability. In this diagram, a few straight lines indicating the strain paths are also shown. The vertical line at the center (zero minor strain) represents the plane strain. In biaxial strain, both strains are equal. It is represented by the inclined line on right side of the diagram. Although the major strain is always positive (stretching), the minor strain may be either positive or negative. If negative minor strain means, there will be shrinkage. It is better to have negative minor strain because the major strain for failure will be higher with negative minor strain. In this graph, the left hand side refers the -ve values of strain states ɛ2 which indicates the combined tension and compression of deep drawing operations. Spat The right hand side refers the +ve values of minor surface strain ɛ2 which indicate the bi- axial tension of stretching operations. Some of the factors which affect the forming limit of a material are: strain rate sensitivity, anisotropy, thickness of the sheet, strain hardening etc. The forming limit curve will be shifted upwards for a thick sheet. Applications of forming limit diagram: 1. The new set of tools in easy, hard or impossible to work can be easily determined. 2. Good materials used in forming operations are identified. 3. Location of source of trouble is also easy from a reference pressing by the designer.1. Formability Tests for Bulk Deformation
2. Formability Tests for Elastic-Plastic Deformation
Manufacturing Processes: Unit IV: Sheet Metal Processes : Tag: : Sheet Metal Processes - Formability test methods
Related Topics
Related Subjects

Manufacturing Processes
ME3393 3rd semester Mechanical Dept | 2021 Regulation | 3rd Semester Mechanical Dept 2021 Regulation