Matrices and Calculus: Unit II: Differential Calculus
Differential Calculus: Function
Definition, Methods of Representing, Examples, Solved Example Problems
Calculus begins with the study of functions. Functions are very fundamental in mathematics.
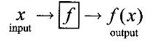
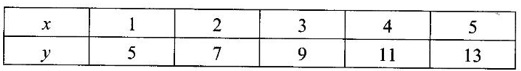
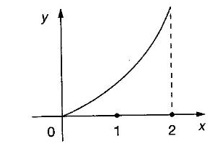
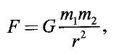
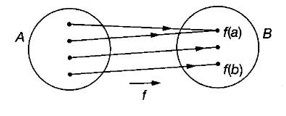
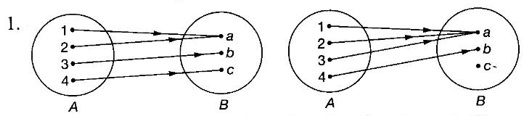
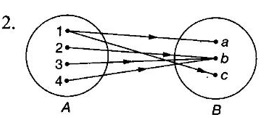
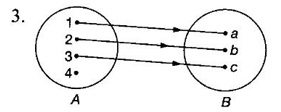
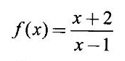
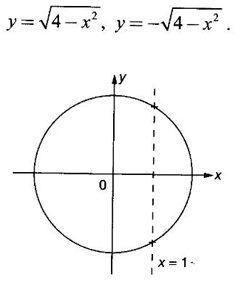
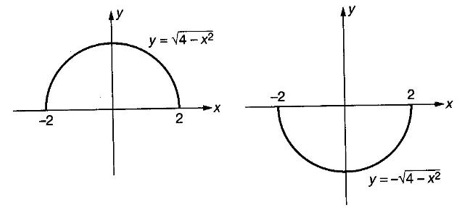
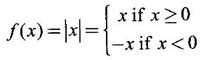
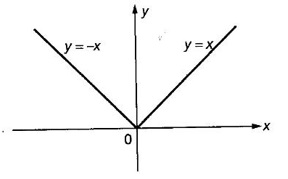
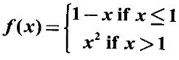
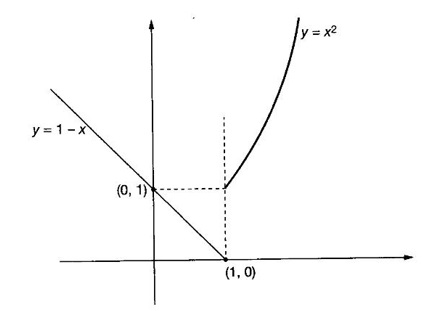
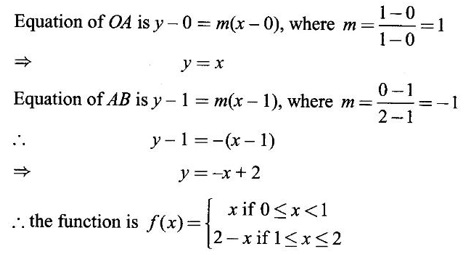
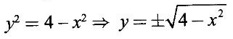
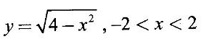
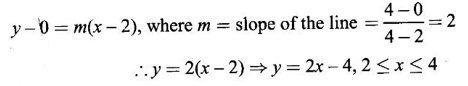
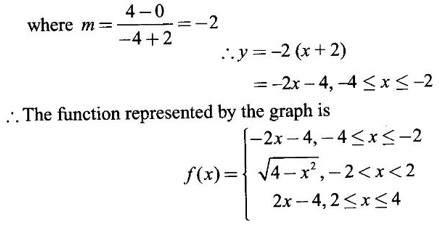
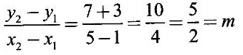
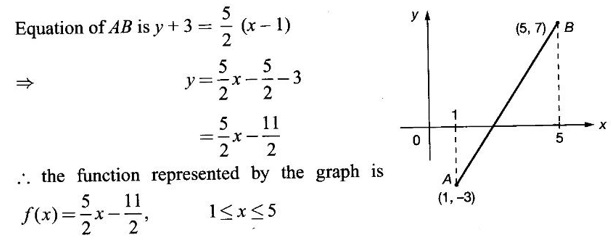
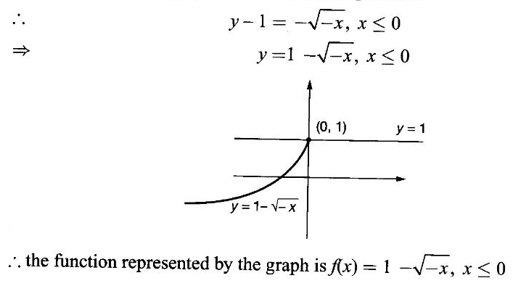
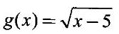
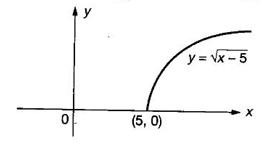
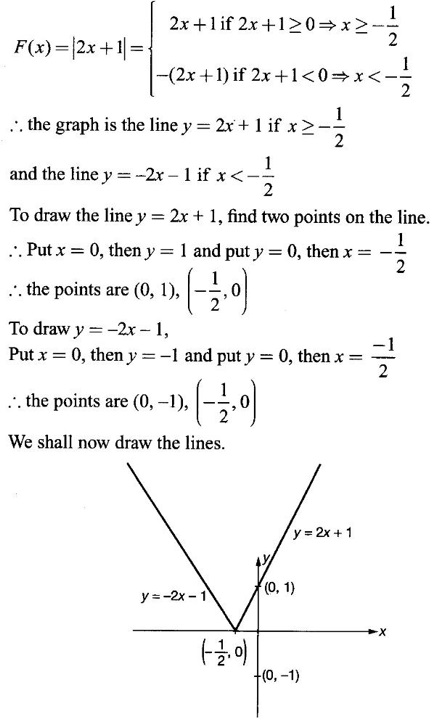
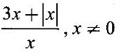
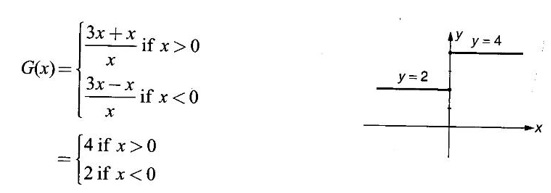
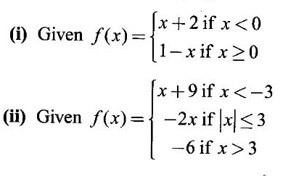
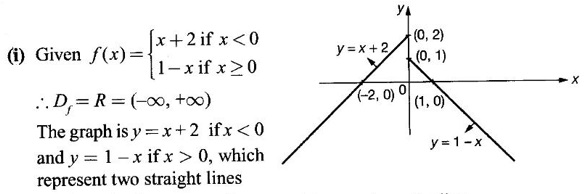
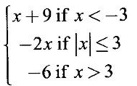
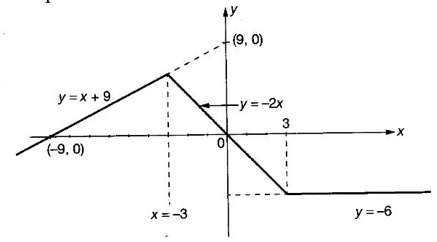
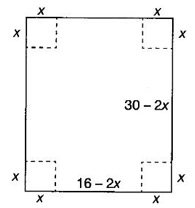
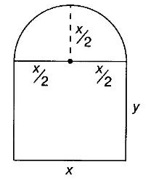
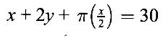
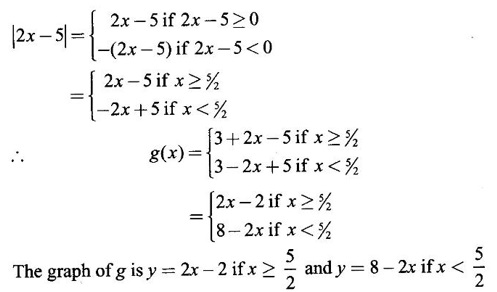
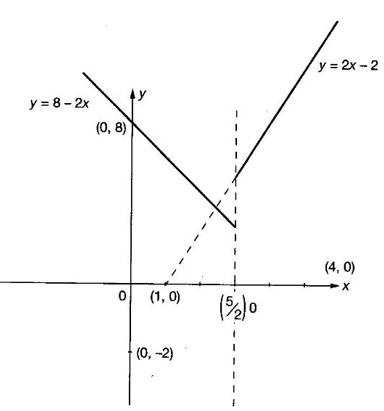
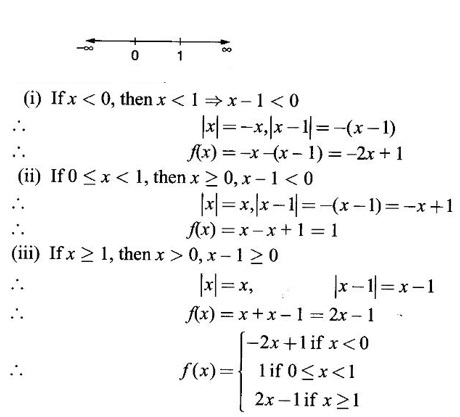
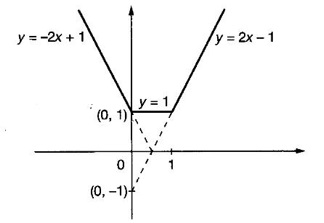
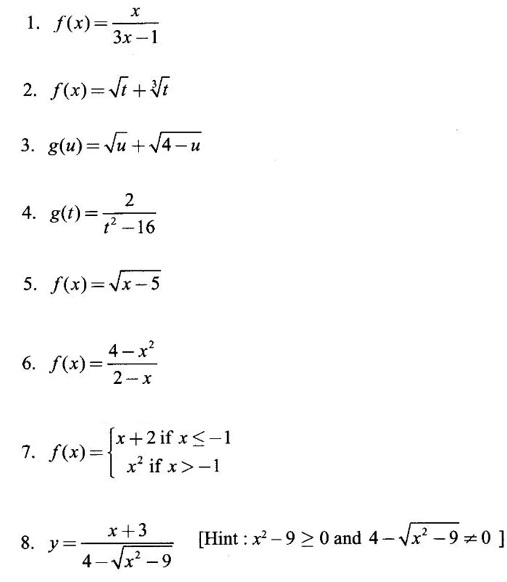
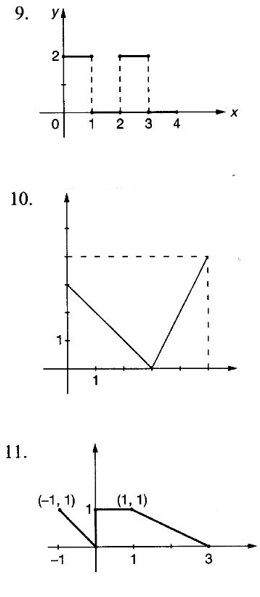
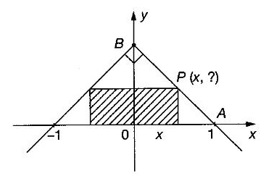
FUNCTION Calculus begins with the study of functions. Functions are very fundamental in mathematics. The term function was coined by Leibnitz in 1673. A function is a tool that scientists and mathematicians use to describe relationship between varying quantities For example: 1. The speed of a rocket is a function of its payload. 2. The price of a ticket is a function of where you sit. 3. The perimeter of a circle is a function of its radius. We now formally define a function. Definition 2.1 Function A function f from a set A to a set B is a rule that assigns to each element x ∈ A a unique element y in B. The element y in B is called the image of x under for the value of ƒ at x and is written symbolically as f(x). Thus, we have y = f(x). The set A is called the domain of the function f and B is called the codemain of f. The set of all values of the function f is called the range of the function. It is denoted by f(A) or Rf and range is a subset of B. Thus, (1) In applications, usually a machine or a system is represented by a function f. So we can consider an element x in the domain of ƒ as input and its value f(x) in the range as output. (2) Suppose ƒ is a function from A to B and y ∈ B such that y = f(x). Then x is called the independent variable and y is called the dependent variable. In other words, a variable in the domain is the independent variable and a variable in the range is the dependent variable. Definition 2.2 Real Functions If the domain and range of a function ƒ are subsets of the real number set ℝ, then ƒ is called a real function We study here only real functions. By a function we always mean real function. There are four common methods of representing a function. 1. Algebraically (by an equation) For example, area A of a circle depends on its radius r and is given by A = πr2. A is a function of r, since for each given r there is unique value for A. 2. Numerically (by table of values) The table of values represents a function, since for each x there is unique value for y. 3. Geometrically or visually (by graphs) The graph represents a function, since for each value of x between 0 and 2 there is unique value for y given by the curve. 4. Verbally (by a description in words) For example, Issac Newton's Law of Universal Gravitation is stated as below. The gravitational force of attraction between two bodies in the universe is directly proportional to the product of their masses and inversely proportional to the square of the distance between them. This is the verbal description of the formula where G is gravitational constant and if m1, m2 are constant masses, then the force of attraction F is a function of r. A function f: A → B can also be represented by an arrow diagram. The assignments are shown by arrows in figure. Examples Test whether the following arrow diagrams define a function from A to B Yes, since for each element in A, there is unique image in B. No, since image of element 1 ∈ A is not unique No, since the element 4 in A is not assigned to any element. Definition 2.3 Graph of a given Function If ƒ is a function with domain D, then the graph of ƒ is the set of ordered pairs {(x, f(x)) : x ∈ D, f(x) ∈ ƒ(D)}. In other words, the graph of the function f consists of the set of points (x, y) in the xy-plane such that y = f(x), x is in the domain of f. Generally, a function is given by an expression or formula. For example, When the domain of a function ƒ is not stated explicitly, it is to be understood that the domain is the set of all real numbers x for which f(x) is real. This set is called the natural domain of the function f. In fact it is the largest possible domain. If we want to restrict the domain for some reason, then it can be done. The range may also then change. The domain and range of a real function are expressed as an interval of real numbers. Closed interval [a, b] = {x |a ≤ x ≤ b} Open interval (a, b) = {x |a < x < b} One side open interval [a, b) = {x |a ≤ x < b} (a, b] = {x |a < x ≤ b} x ≥ a ↔ [a,∞); x > a ↔ (a, ∞) 1. If a > 0, consider the quadratic inequality ax2 + bx + c ≥ 0 or ≤ 0 If ax2 + bx + c = 0 has real and different roots α, β (α < β) Then ax2 + bx + c = a(x − α)(x - β) ⸫ ax2 + bx + c ≥ 0 ⇒ (x − α) (x - β) ≥ 0 ⇒ x − α ≥ 0 and x - β ≥ 0 ⇒ x ≥ α and x ≥ β ⇒ x ≥ β or x − α ≤ 0 and x - β ≤ 0 ⇒ x ≤ α and x ≤ β ⇒ x ≤ α ⸫ solutions of ax2 + bx + c ≥ 0 are x ≤ α or x ≥ β (1) i.e., the solutions lie outside the interval [α, β] Find the domain of the following functions Solution We shall denote the domain of ƒ as Dƒ. Find the domain and range of the following functions Solution To decide whether a given graph represents a function or not, we have a simple test called the vertical line test. A given curve in the xy plane is the graph of some function f, if no vertical line meets the curve more than once. For example, consider the two graphs given below The graph in fig (i) represents a function because no vertical line meets the curve more than once. The graph in fig (ii) does not represent a function because a vertical line meets the curve more than once. Algebraically, at x = a, the image, which is the value of y, is not unique. Therefore it is not a function. Example 18 Consider the equation x2 + y2 = 4 Discuss it represents a function or not. Solution Given x2 + y2 = 4 Its graph is a circle with centre (0, 0) and radius 2. The vertical line x = 1 meets the curve in 2 points. So, it does not represent a function. If we solve algebraically, we get two solutions They represent the upper and lower semicircles and their union is the full circle. Each of these satisfy the vertical line test and so they represent 2 functions So the equation x2 + y2 = 4 represent 2 functions This leads to the concept of piecewise-defined function or split-definition of function. Its graph is given by the equations y = x if x ≥ 0 and y = -x < 0 For example, If x = -5, then f(-5) = -(-5) = 5 If x = 3/2, then f(3/2) = 3/2 The graph of absolute value function is shown here From the graph we find |x| ≥ 0 ∀ x Its domain is R = (-∞, + ∞) and range = [0, ∞) Remark: If x ∈ R, √x2 = |x| √4 = ± 2 is wrong, but √4 = 2 Greatest integer function (or floor function) [x] = the greatest integer ≤ x. ⸫ [2.9] = 2, [−2.9] = −3 The graph resembles steps and so it is called a step function. Its domain is R = (-∞, ∞) but range is Z = {0, ±1, ±2, ....} [x] is also denoted by [x] and is called integer floor function in computer science and other areas. Example 19 A function ƒ is defined by Evaluate f(0), ƒ(1); ƒ(2), ƒ(−2) and sketch the graph Solution Given Since 0 and 1 lie in x ≤ 1, f(0) = 1 − 0 = 1, f(1) = 1−1 = 0 Since 2 > 1, f(2) = 22 = 4, f(−2) = 1-(-2) = 3, since -2 < 1 For x ≤ 1, the graph of the function is y = 1 − x, which is a straight line. Put x = 0, then y = 1 Put y = 0, then x = 1 Two points on the line are (1, 0), (0, 1) For x > 1, y = x2 is the parabola, which is a known curve. So we draw the graph. Example 20 The graph of a function ƒ is given here (i) Find ƒ(1) and f(5) (ii) What are the domain and range of f? Solution (i) we note that the point (1, 3) lies on the graph ⸫ f(1) = 3 When x = 5, the graph is about 0.7 unit below x-axis ⸫ ƒ(5) = −0.7 (ii) The graph is drawn in the interval [0, 7] ⸫ the domain of the function is the closed interval [0, 7] The values of y lie between −2 and 4 ⸫ Range Example 21 Find the formula for the function given by the graph. Solution The given graph is a triangle OAB, where 0(0, 0), A(1, 1), B(2, 0) Example 22 Find an expression for the function whose graph is the given curve Solution The given graph consists of a semicircle with centre (0, 0) and radius = 2 and two line segments joining (2, 0), (4, 4) and (-2, 0), (-4, 4). The equation of circle is x2 + y2 = 4 Equation of upper semicircle is Now the equation of the line joining the points (2, 0) and (4, 4) is The equation of the line joining (−2, 0) and (-4, 4) is y − 0 = m (x + 2), Example 23 Find the expression for the function whose graph is the line segment joining the points (1,-3) and (5, 7) Solution The graph of the line segment joining the point A (1, −3) and B (5, 7) is shown here Slope of AB = Example 24 Find the expression for the function whose graph is the bottom half of the parabola x + (y − 1)2 = 0. Solution The given parabola is (y - 1)2 = -x [y2 = -4ax form] Vertex is (0, 1) and axis of symmetry is y = 1 and the curve is towards the negative x-axis. The graph is the bottom half parabola Example 25 Find the domain and sketch the graph of the functions Solution (a) Given g(x) = The domain is the set of values of x for which g(x) is real ⇒ x – 5 ≥ 0 ⇒ x ≥ 5 ⸫ Dg = [5, ∞) To draw the graph: This is a parabola with vertex (5, 0) and axis y = 0 is the x-axis and the curve is towards the positive x-axis. Since y ≥ 0, the curve is the upper half parabola. (b) Given F(x) = |2x + 1| F(x) is real for all x ∈ R DF = R = (-∞, ∞) (c) Given G(x) = ⸫ DG = R - {0} ⸫ the graph is y = 4 if x > 0 and y = 2 if x < 0 (d) Given g(x) = ⸫ Dg = R - {0} Example 26 For the following piece-wise defined functions find the domain and sketch the graph Solution To draw the line y = x + 2, we need two parts on the line. ⸫ Put x = 0, then y = 2 and put y = 0, then x = -2 ⸫ the points are (0, 2) and (−2, 0) To draw the line y = 1 - x, we need two parts on the line. Put x = 0, then y = 1 and put y = 0, then x = 1 ⸫ the points are (0, 1), (1, 0) The two lines are drawn as in figure. (ii) f(x) = ⸫ Domain is Df = R = (−∞, ∞) The graph is y = x + 9 if x < -3 y = -2x if -3 ≤ x ≤ 3 and y = -6 if x > 3 To draw the line y = x + 9, we need two points on the line. ⸫ put x = 0, then y = 9 and put y = 0, then x = -9 ⸫ the two points are (0, 9), (−9, 0) y = -2x passes through the origin. y = -6 is parallel to the x-axis We shall now find functions from verbal problems. Example 27 An open box is to be made from a rectangular cardboard of size 16 × 30 meters by cutting off equal squares from the four corners and then bending up the sides. Find the volume as a function of the side x of the square. Solution Given board is 16 × 30 meters Equal squares are cut off from the corners Let x meter be the side of the squares cut of from the corners. Then sides of the box will be 16 - 2x, 30 - 2x, x and x ≥ 0 ⸫ the volume of the box will be V = (16 – 2x) (30 – 2x) x we must have 16 - 2x ≥ 0 ⇒ x ≤ 8 and 30 - 2x ≥ 0 ⇒ x ≤ 15 The common values will be x ≤ 8 ⸫ the volume function is V(x) = (16 – 2x) (30 – 2x) x, 0 ≤ x ≤ 8. Example 28 A Norman window has the shape of a rectangle surmounted by a semicircle. If the perimeter of the window is 30 m, express the area A of the window as a function of the width x of the window Solution Let x be the width of the window Then radius of the semicircle is x/2 If y is the height of the window, then perimeter of the window (not including the base of semicircle) is Definition 2.4 A function f is said to be even if f(−x) = f(x) and odd if f(−x) = -f(x) for all x in its domain D. Remarks: can an even or odd function exist in the interval [1, 3] ? No, if x ∈ [1, 3] then -x ∉ [1, 3] and so f(-x) is not defined on [1, 3]. Hence the definition can not be satisfied. ⸫ even or odd functions do not exist on [1, 3] Hence the definition implies that for even or odd function to exist, the domain D should be an interval of the form (-a, a) or [-a, a] Geometrically, the graph y = f(x) of an even function is symmetric about the y-axis, since for every point (x, y) on the graph the points (-x, y) also lie on the graph. The graph y = f(x) of an odd function is symmetric about the origin, since for every point (x, y) on the graph the points (-x, -y) also lie on the graph. Example 1 Determine the following functions even, odd or neither 1. f(x) = x2 + x 2. g(x) = 1- x4 3. h(x) = 2x - x2 4. f(x) = x|x| 5. y = x - sin x Solution Note that the domain of the functions from (1) to (5) is R = (-∞, ∞). So, we can discuss even or odd nature Example 2 Determine the domain of the function given by Solution Given f(x) = We know log, x is defined if x > 0 Example 3 Express the following functions in piece-wise form and draw their graph. 1. g(x) = 3 + |2x -5| 2. f(x) = |x| + |x -1| Solution 1. Given g(x) = 3 + |2x -5| By the definition of modulus function, we get To draw the line y = 2x - 2, we need two points on the line Put x = 0, then y = -2 and put y = 0, then x = 1 ⸫ the points are (0,-2), (1, 0) Similarly, the two points on the line y = 8 - 2x are (0, 8), (4, 0) 2. Given f(x) = |x| + |x -1| The values x = 0 and x = 1 decide the rewriting of these modulae. 0 and 1 divide the real line into 3 parts. So, we have 3 cases, The graph of the function y = -2x + 1, y = 1 and y = 2x - 1, which are straight lines. To draw the line y = 2x + 1, we need two points on the line. ⸫ put x = 0, then y = 1 and put y = 0, then x = 1/2 ⸫ two points on the line are (0, 1) and ( 1/2, 0). Differential Calculus 2-25 y = 1 is line parallel to the x-axis between x = 0 and x = 1 To draw the y = 2x - 1, we need two points on the line put x = 0, then y = -1 and y = 0, x = 1/2 ⸫ two points on the line are (0, −1) and ( 1⁄2, 0) Now, we draw the graph The graph resembles a trough and so, it is called a trough function. Find the domain of the following functions Find the formula for each function represented by the graphs below. Find formula for the function in the following 12. An open rectangular box with volume 2 m3 has a square base. Express the surface area of the box as a function of the length of a side of the base. 13. The point (x, y) lies on the graph of the line 2x + 4y = 5. If L is the distance from (x, y) to the origin. Write L as a function of x. 14. The figure shows a rectangle inscribed in an isosceles right triangle whose hypotenuse is 2 units. (a) Express the y-coordinate of P as function of x. (b) Express the area of the rectangle as a function of x. Hint: A(1, 0), B(0, 1): Equation of AB is x + y = 1 ⇒ y = 1 − x ⸫ y-coordinate of P is y = 1 - x, 0 < x < 1.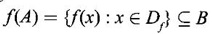
1. Methods of Representing a Function
2. Arrow Diagram
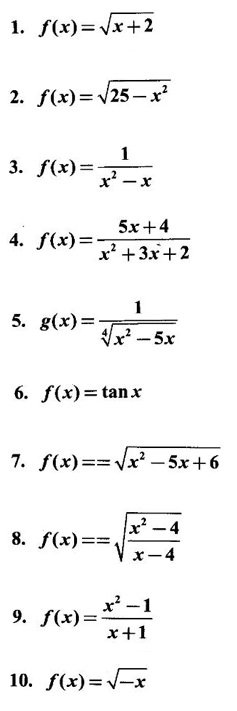
3. Domain and Range
4. Intervals
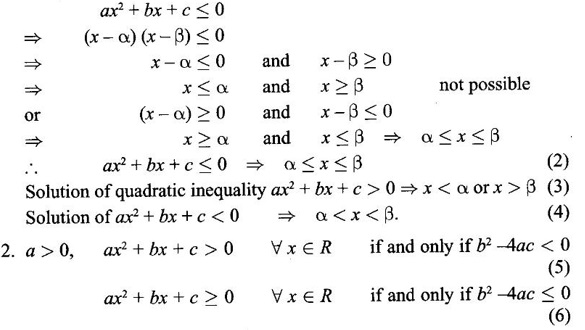
5. Solution of Quadratic Inequalities
WORKED EXAMPLES
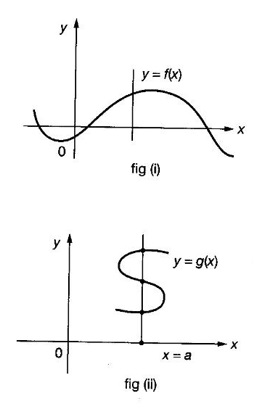
 We have seen that given a function, its graph can be drawn in the xy-plane. But every graph in the xy-plane is not a function.
6. The Vertical Line Test
WORKED EXAMPLES

7. Absolute Value Function
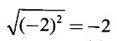 is wrong, but
  = |-2| = 2. Square root of a positive number is positive.
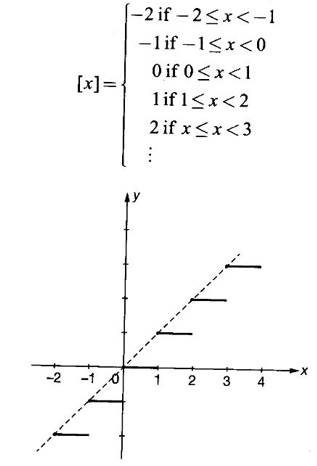
WORKED EXMPLES

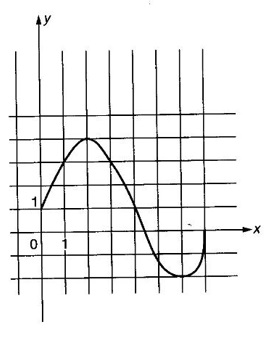
![]() = [-2, 4].
= [-2, 4].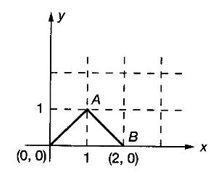


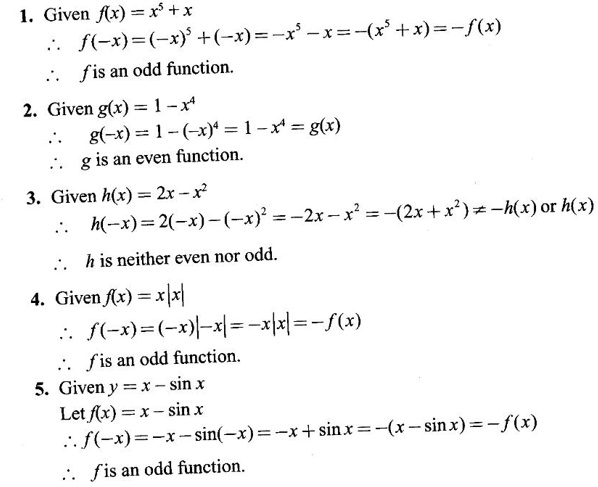
8. Even and Odd Function
WORKED EXAMPLES
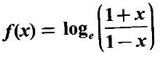 and test it is even or odd.

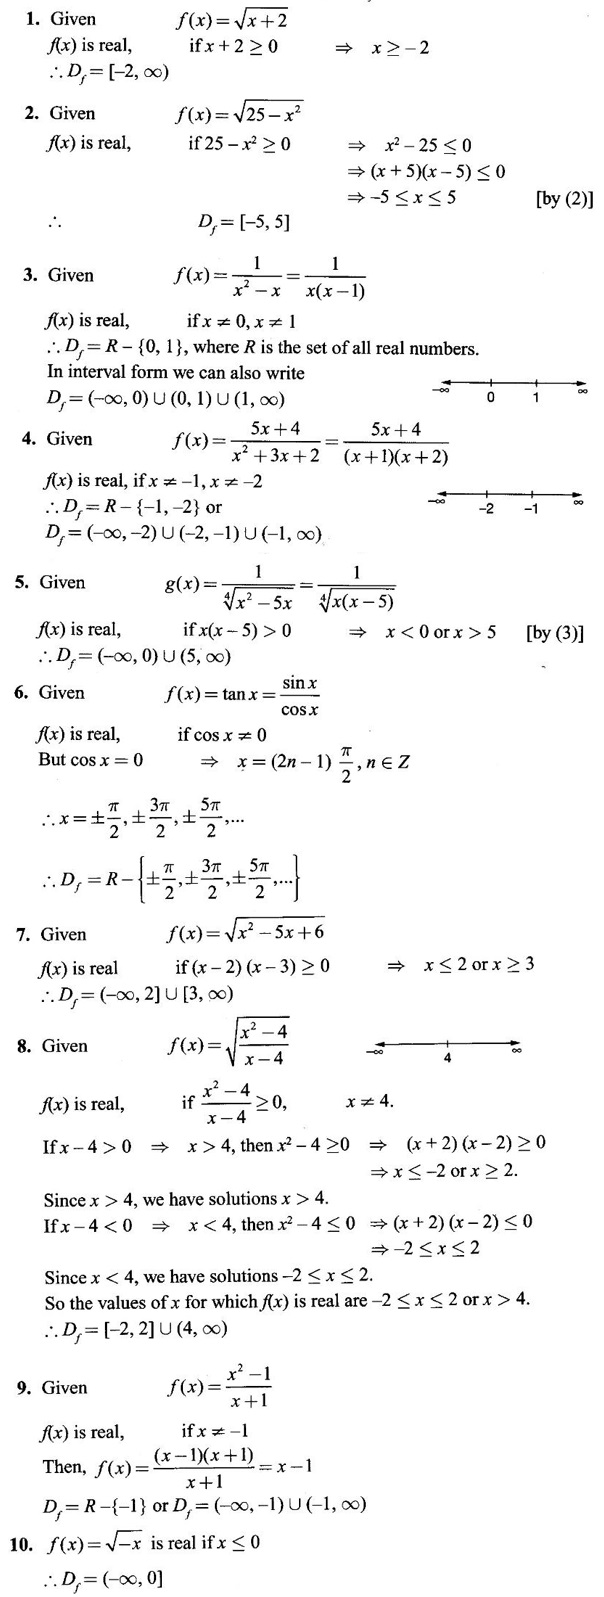
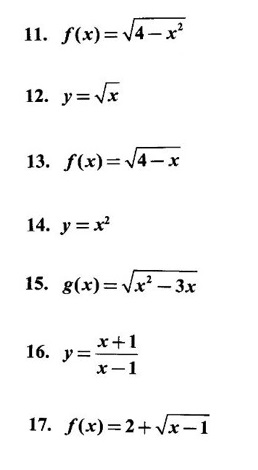
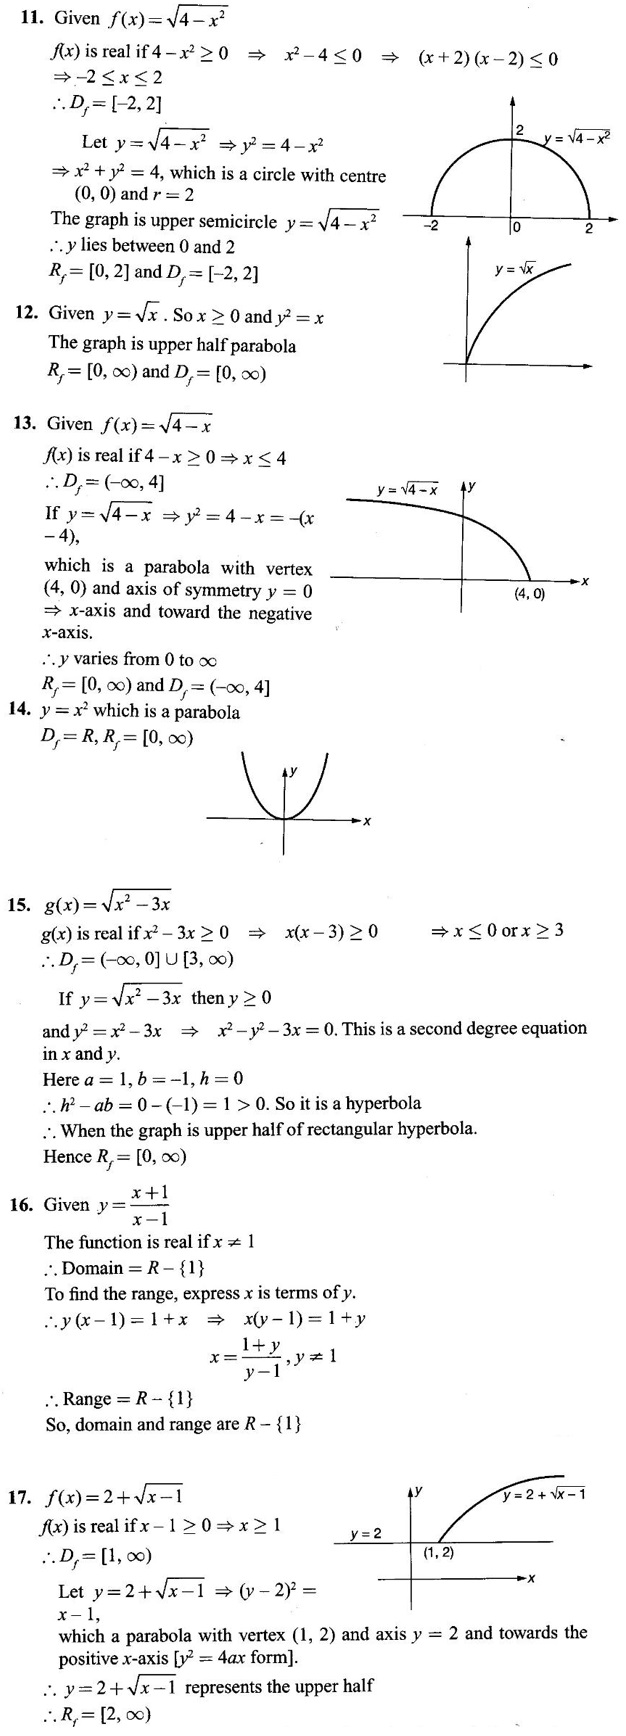
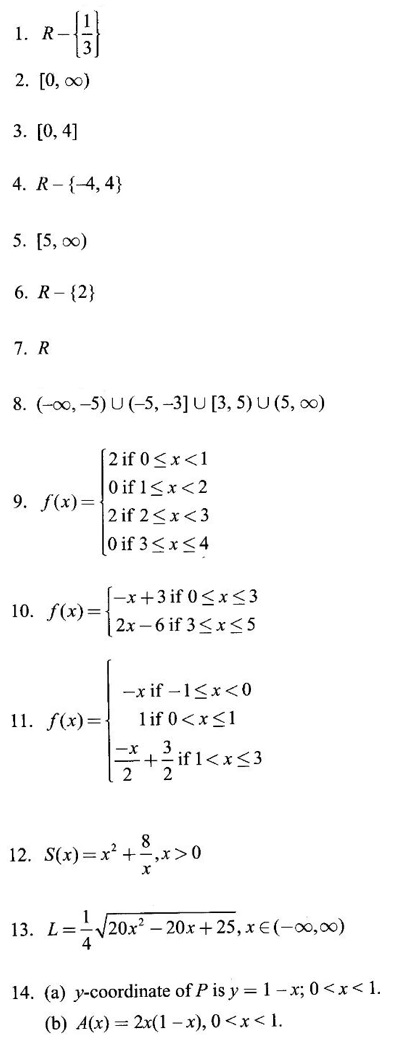
EXERCISE 2.1
ANSWERS TO EXERCISE 2.1
Matrices and Calculus: Unit II: Differential Calculus : Tag: : Definition, Methods of Representing, Examples, Solved Example Problems - Differential Calculus: Function
Related Topics
Related Subjects
Matrices and Calculus
MA3151 1st semester | 2021 Regulation | 1st Semester Common to all Dept 2021 Regulation